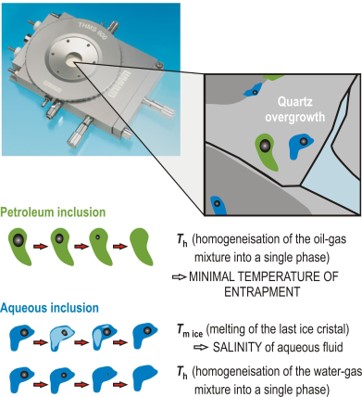
The final ice melting temperatures (Tm ice) of aqueous fluids are translated into salinity.
In the case of fragile minerals, Raman analysis of the water phase can help us to approximate salinity, taking into account mineral optical properties.
The nature of solids, trapped in inclusions at ambient or low temperatures, can be determined.
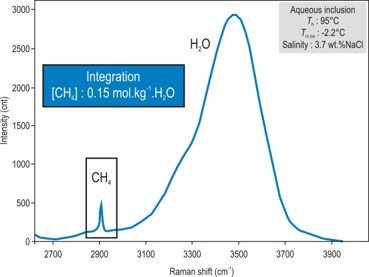
Characterisation of dissolved gas (CH4, CO2, H2S, H2, O2, N2).
Quantification of dissolved CH4, CO2 and H2S.
Gas speciation can be evidenced (HCO3-, CO3=, HS-, SO4=, HSO4-,…)
Observation with microscope equipped with LINKAM microthermometric platinum
Drawing of various transitions observed in microthermometry in aqueous and oil inclusions
Video of a liquid phase homogenization (L+V → L) of an aqueous inclusion
Gas phase
Phase transition inside gas inclusions gives information on gas nature and concentration
Determination of the P-V-X properties of binary or ternary mixtures of CH4, CO2, and N2
Raman spectrum with H20 and CH4 peaks
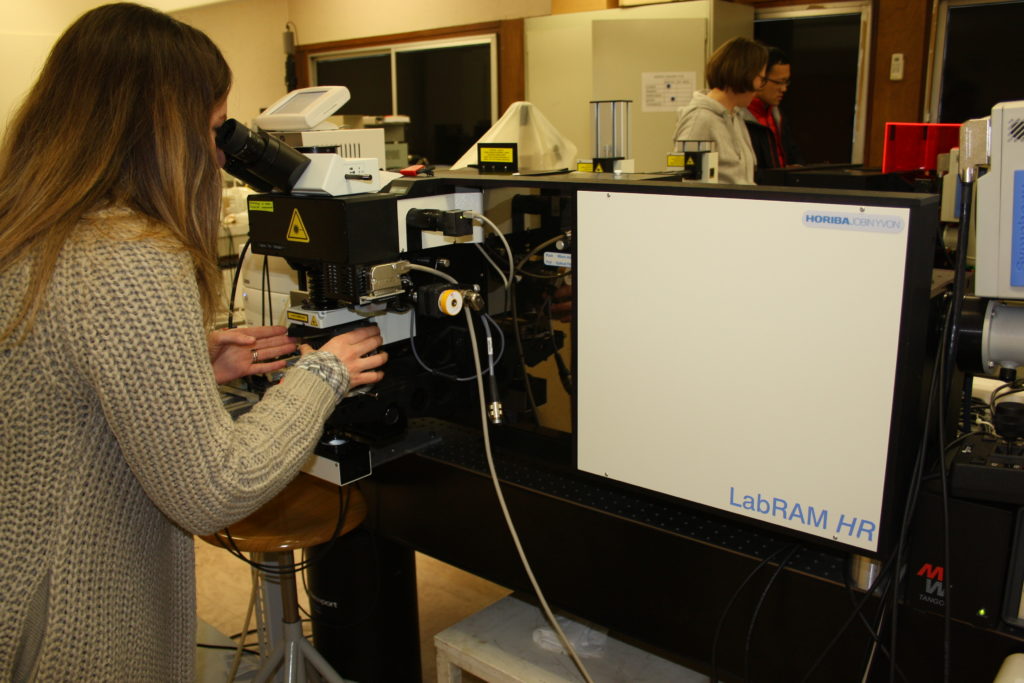
Analyze with Raman microspectrometer (LabRAM, Horiba Jobin Yvon)
Oil liquid phase
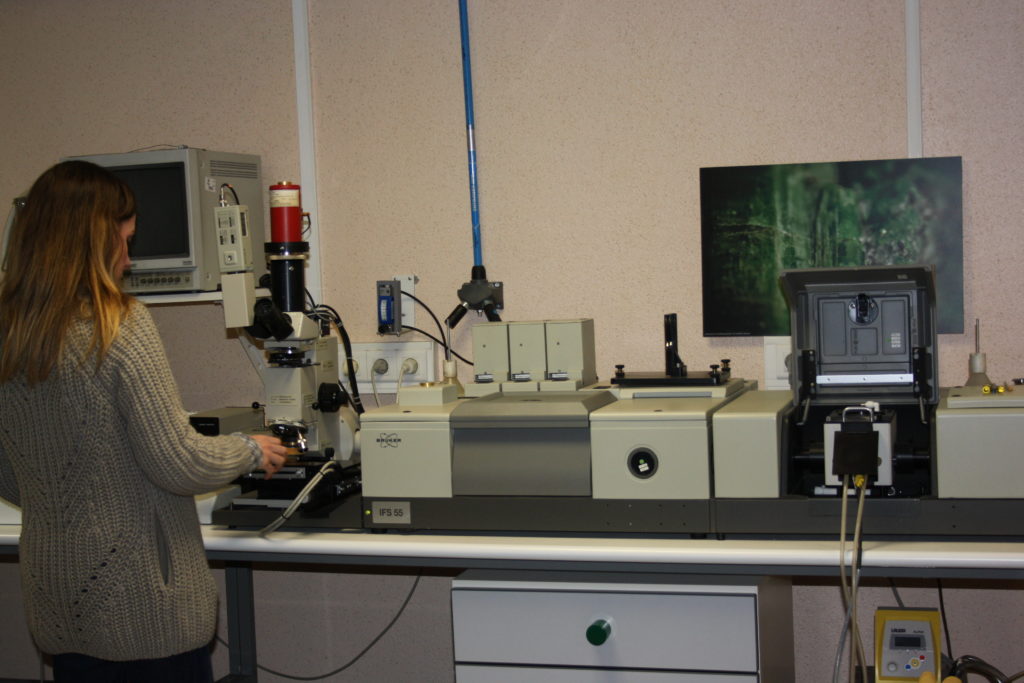
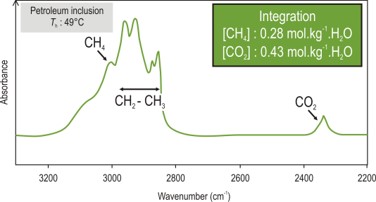
Quantitative analysis (CH4, CH2, CH3, CO2) with FT-IR.
Phase transition (L1+L2+V–>L+V) in hydrocarbons reveals the presence of gas condensates.
Chemical mapping of inclusions can be realized at the scale of 1 micron.